
Pull up the member count on your Telegram right now. Ten thousand, say, climbing nicely. Now open the chat itself and count how many of the last fifty messages were a real person asking or answering something, rather than a bot farming an airdrop checklist or a ghost who joined during a listing pump and never came back. For most projects that number is grim, and it is the gap between those two counts that your reporting never shows anyone.
This piece builds the crypto community management scorecard that closes that gap, the kind of operating model a lot of crypto marketing teams never get around to writing down. Not another "engagement beats vanity metrics" lecture, you've read five of those this month, but five KPI families with actual metrics inside them: activation, contribution, support quality, trust and safety, retention, plus the signal-to-noise and moderator-operations metrics that sit underneath all of them. None of it requires buying a bot or hiring a data team. It requires deciding what you're actually going to watch, and then watching it the same way every month.
Why Member Count Misleads
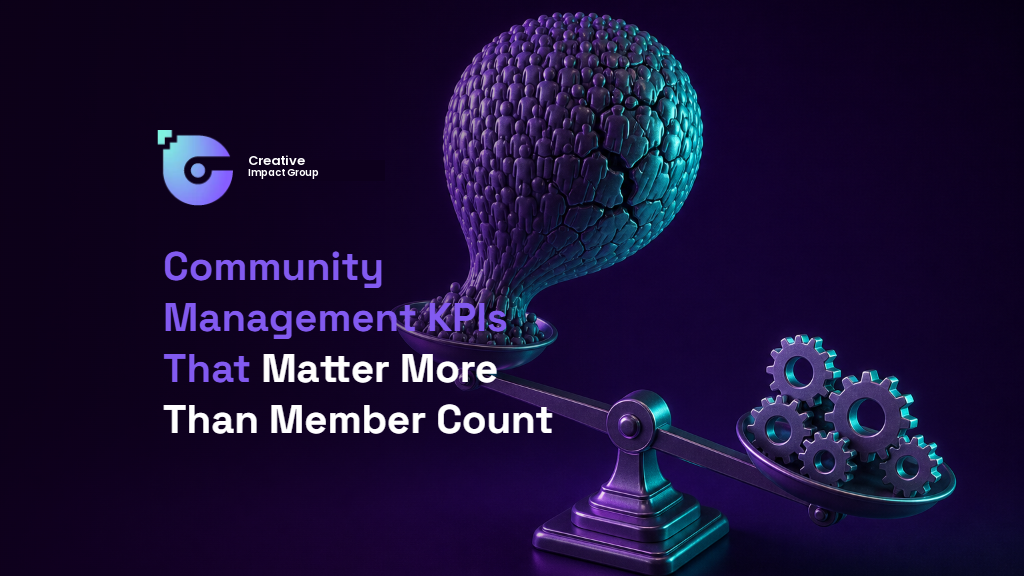
Member count misleads because it counts joining, not staying, and joining is nearly free. A link in a presale announcement, a quest platform offering points for a "join Discord" click, a bot script that can add five hundred accounts before your mod team finishes their coffee: all of it inflates the number at the top of your report without a single one of those accounts caring whether your project exists tomorrow.
Bots are the obvious distortion, but overlap is the quiet one. The same hundred wallet-hunters who joined your Telegram for an airdrop are sitting in forty other project channels doing exactly the same thing, so your "community" is partly other projects' community wearing a different avatar.
Airdrop and quest campaigns produce a visible spike on the growth chart followed by a cliff a few weeks later. If your only metric is the peak, you'll report the spike as a win and miss the cliff as the actual story.
Channel overlap compounds it further. Someone who posts in your announcements channel, your trading channel, and your governance channel gets counted as three data points of "engagement" in some dashboards when it's one person having one opinion three times. A talk on Web3 community metrics makes a similar point bluntly: a community can carry 100,000 Discord members with no meaningful activity, no contributors, and no real participation behind the number.
Here's the shape of the problem in practice. One scenario worth sitting with: a project with 50,000 Discord members where under 1% have ever posted anything, set against a community a fraction of that size where roughly a fifth of members show up to vote on proposals or join a feedback call. Raw size tells you which one looks better on a pitch deck. It tells you nothing about which one will still exist in a year.
The Five KPI Families

A real community operation tracks five families of metrics, not one headline number. Each answers a different question: who showed up, who's doing anything useful, who's getting helped, who's being kept safe, and who's still here next month.
- Activation — of everyone who joined, how many did anything at all in their first week. Read a pinned message, reacted, asked a single question. This is the first filter between "joined" and "arrived."
- Contribution — the share of active members producing something of value: answering another user's question, writing feedback, submitting a bug report, showing up to a governance call.
- Support quality — how well the team handles the questions and problems that come in, measured by response time and resolution, not by how many support messages got sent.
- Trust and safety — how well the community is protected from scams, impersonation, and harassment, and how fast genuine threats get caught versus how often innocent members get wrongly flagged.
- Retention — whether people who were active last month are still active this month, which is the only family that actually tells you if the community is compounding or just replacing itself.
A community can score well on activation and badly on trust and safety. Picture a flood of new joiners during launch week, half walking straight into a phishing link posted by a fake "support" account before your mods catch it. Treat these five as a dashboard, not a league table: a project is healthy when all five hold up together, not when one looks good in isolation.
Building the reporting model behind these families, the dashboards, the thresholds, the escalation paths, is exactly the kind of operating work our crypto community management team does day to day rather than something bolted on after a campaign.
Define a Signal-to-noise Metric
Signal-to-noise is the ratio of useful contributions to everything else in your channels: spam, duplicate support tickets, and the moderation chatter generated by both. It is the single metric most dashboards never surface, because most dashboards count messages, and a message count treats a genuine question and a repost of the same scam link as identical events.
Here's how to calculate it:
- Sample a fixed window, 500 messages is a workable size for most channels
- Sort each message into "signal" (a new question, a substantive answer, feedback nobody was paid to give) or "noise" (spam, a duplicate of a question answered in the last hour, off-topic chatter, moderator warnings)
- Divide total signal messages by total messages sampled
- Repeat the same sampling method each month so the number is comparable to itself over time
The value isn't the absolute figure, it's the trend and what moves it. A ratio that drops sharply after an airdrop announcement tells you the campaign brought volume without value. A ratio that holds steady while raw message count doubles tells you the growth is real.
Treat this as directional evidence about your own community's behavior over time, not as a score to compare against another project's channel. Sampling method and channel purpose both shift the number in ways that make cross-project comparison close to meaningless.
Measure Moderator Operations
Moderators are usually the least-measured part of a community operation despite running the part most likely to blow up in public. Five metrics make their work visible:
- Response SLA — time from a member raising an issue to a human replying, not an auto-response
- Escalation quality — whether a report that got escalated to a senior mod or the team actually needed escalating, which catches both the mod who escalates everything out of caution and the one who sits on real problems too long
- False-positive rate — how often an automated filter or a quick ban call turns out to be wrong, because a trigger-happy anti-spam bot that mutes genuine new members is a trust-and-safety cost even when it's also catching real spam
- Resolved reports — how many flagged messages, scam alerts, or user complaints are still open after 24 or 48 hours
- Staff workload — messages handled per moderator per shift, which exists to stop the other four metrics from improving only because someone is burning out to make them look good
That last point matters more than it sounds. Researchers at the University of Michigan's School of Information have studied volunteer content moderators and found burnout driven by interpersonal conflict between moderators, time pressure, and daily exposure to toxic behavior. That's a fair description of what an unpaid or under-resourced Discord mod team absorbs during a bad week.
A scorecard that tracks response speed without tracking who's answering, and how often, is measuring a number that someone is quietly paying for. A shift rota and an escalation ladder do more for a mod team's staying power than any amount of bot tooling, which is as much an operational decision as a staffing one.
Connect Community to Product Carefully
Community data and product data belong on the same page, but they do not prove causation and you should never report them as if they do. What you can do honestly is compare the themes.
Look at feedback themes against your actual roadmap: are the complaints and requests showing up in community channels the same ones your product team is already working on, or is there a gap? Track event participation too: how many people who RSVP to an AMA or a community call actually show up, and does that number hold steady or decay.
Watch repeat use among community members specifically, not the whole user base, since a community member using the product weekly is a different signal than one who joined for a single mint. And track referrals, people who joined because an existing community member sent them, as a measure of advocacy rather than a growth channel to optimize.
None of this tells you that community activity caused a spike in product usage, or that a quiet Discord caused a drop in anything. Communities and products move for dozens of reasons at once, and a founder who reports a correlation as a cause is setting up next quarter's report to contradict this one. Treat the comparison as a diagnostic, not a KPI with a target attached.
Build a Monthly Operating Review
A monthly review turns these metrics from numbers in a spreadsheet into decisions, and it needs four fixed components: baselines, segments, incident annotations, and a list of actions.
Set your own baseline for each metric in month one and compare every subsequent month against it, never against another project's numbers or a generic industry figure. Discord's own Server Insights feature is a reasonable place to pull raw activity data from, but it comes with real limits worth knowing before you lean on it.
Insights only becomes available once a server passes 500 members and is designated a Community Server. Even then it only surfaces engagement signals like Visitors versus Communicators, the difference between a member who clicked into a channel and one who actually posted or spoke.
The underlying audience data is narrower still. Discord's own documentation notes that the Audience tab only reflects members who visited the server within the past 28 days, not your full member list. A project under 500 members gets none of this natively and has to build its own counting.
Even above that threshold, Discord doesn't publish a universal healthy range for any ratio. It only tells you what categories of data exist, not what counts as good. A ratio that looks weak for a 50-person alpha community might be strong for a 50,000-member public server, so the baseline has to be yours.
Segment your audience before you report on it as one block. New joiners in their first 30 days behave nothing like members who've been active for six months, and blending them hides whether your activation problem is actually a retention problem wearing a different name.
Annotate the timeline with incidents: a token unlock, a listing, a security scare, an airdrop announcement, so a dip in signal-to-noise next to a known spam wave reads as expected rather than alarming.
Here's an example of how a monthly review sheet might look. The figures below are illustrative only, a template to adapt, not benchmarks from any live campaign:
| Metric | This Month | Last Month | Baseline | Note |
| Activation (7-day) | 18% | 22% | 20% | Dip follows quest-platform listing |
| Contribution rate | 6% | 5% | 5% | Steady improvement |
| Signal-to-noise | 0.41 | 0.52 | 0.45 | Spam wave, filter updated |
| Mod response SLA | 14 min | 11 min | 15 min | Within target |
| 30-day retention | 61% | 64% | 60% | Normal variance |
Every review ends with decided actions, not just observed numbers: tighten the anti-spam filter, add a mod shift during launch windows, change the onboarding message. A review that produces a chart but no decision is a report, not an operating review.
Conclusion
Member count tells an investor or a journalist a story in five seconds. It tells you, the person running the thing, almost nothing about whether the community works. The five families here, activation, contribution, support quality, trust and safety, and retention, backed by a signal-to-noise figure and a set of moderator-operations metrics, give you a set of Web3 community health metrics you can actually run a team against.
Use the table below as a starting template and adjust the specific metrics to what your community actually does.
| Family | Core Metric | What It Catches |
| Activation | % of new joiners active in week one | Dead-on-arrival joins, bot floods |
| Contribution | Share of active members posting useful content | Lurker-only communities |
| Support quality | Response time to first reply | Support debt, burned-out mods |
| Trust and safety | False-positive rate, resolved reports | Over-moderation, unresolved scams |
| Retention | 30-day active-to-active ratio | Communities that only ever replace themselves |
If your report ends at member count, it cannot explain community health. Ask Creative Impact Group to build a KPI scorecard tied to contribution, trust, and operations, scoped to how your community actually behaves rather than a template borrowed from someone else's Discord. Contact Creative Impact Group to talk through what that would look like for yours.
FAQs
Which KPIs should a new crypto community track first?
Start with activation and support quality, since both are visible within the first thirty days and both expose problems before they compound. Activation tells you whether new joiners are doing anything at all in week one; support quality tells you whether the team is actually keeping up with questions. Trust and safety and retention matter just as much, but they need a longer baseline before the numbers mean anything, so don't panic if those two look thin in month one. See our case studies for how that staged rollout plays out for different community sizes.
How do we measure contribution quality?
Sample a window of messages and sort each one by what it actually did: answered someone else's question, offered feedback, filed a bug report, or just added noise. The share of active members producing that kind of output, rather than the volume of messages overall, is the number worth tracking. A limitation worth naming here is that this scoring is manual and a little subjective, so keep the same person or the same rubric doing the sorting each month or the trend line will drift for reasons that have nothing to do with your community.
Should wallet connections be a community KPI?
No, not on its own. A connected wallet tells you someone has holdings; it tells you nothing about whether they read your announcements, help other members, or will still be around next quarter. Treat wallet data as a segment to cross-reference against actual behavior, such as whether holders are also the ones answering questions or showing up to calls, rather than as a loyalty or identity signal in its own right.
What is signal-to-noise ratio?
It's the share of messages in a channel that are genuinely useful, a new question, a real answer, unpaid feedback, divided against spam, duplicate support requests, and moderation chatter. You calculate it by sampling a fixed batch of messages and sorting each one, which means the number is only as reliable as your sampling method and shouldn't be compared across different projects' channels.
How can moderators be included in a KPI dashboard?
Track response SLA, escalation quality, false-positive rate, resolved reports, and staff workload alongside the member-facing metrics, not as a separate internal document nobody reads. The honest trade-off is that measuring mod output too aggressively can push a team toward speed over judgment, which is exactly the pattern that burns moderators out, so staff workload needs to sit on the same dashboard as a check against the other four. Our guide on in-house crypto community management covers how to structure that reporting without turning it into a surveillance exercise.